Data brokers
The data broker market, which trades in personal data, plays a prominent role in the global economy. The growing volume of personal data collected makes it possible to build detailed and accurate population profiles.
The analysis of consumer groups and segments helps organizations with:
- Targeted offers
- Prospecting
- Monetization of the customer portfolio
- Targeted communication
- Statistical modeling
- Market studies (such as profile and consumption analysis)
- Geomarketing
You probably know some of the main data brokers:
- Experian
- TransUnion
- Equifax
- Cotality (formerly CoreLogic)
- Epsilon
- Acxiom
Experian Mosaic: UK consumer segmentation
Experian offers a service called Mosaic, a cross-channel consumer classification. It groups individuals who are likely to share similar demographics, lifestyles and behaviours into groups and detailed types, each with a code and a name. The current (eighth) release has 18 groups and 68 types:
| Group code | Group | Type code | Type |
|---|---|---|---|
| A | Lavish Lifestyles | A01 | Mansion Millionaires |
| A | Lavish Lifestyles | A02 | Exclusive Enclaves |
| A | Lavish Lifestyles | A03 | City Society |
| B | Pension Prosperity | B04 | Silver Serenity |
| B | Pension Prosperity | B05 | Golden-age Couples |
| B | Pension Prosperity | B06 | Settled Maturity |
| B | Pension Prosperity | B07 | Retirement Aims |
| C | Country Heritage | C08 | Rural Landowners |
| C | Country Heritage | C09 | Room to Grow |
| C | Country Heritage | C10 | Rural Kinship |
| C | Country Heritage | C11 | Village Retreats |
| D | Upmarket Commuters | D12 | Flourishing Families |
| D | Upmarket Commuters | D13 | Garden-belt Groves |
| D | Upmarket Commuters | D14 | Equity Havens |
| D | Upmarket Commuters | D15 | Greenfield Dreamers |
| E | Respectable Retirement | E16 | Solo Veterans |
| E | Respectable Retirement | E17 | Parish Pensioners |
| E | Respectable Retirement | E18 | Stable Sanctuary |
| E | Respectable Retirement | E19 | Sunset Views |
| E | Respectable Retirement | E20 | Bungalow Destination |
| F | Mature Homekeepers | F21 | Kept in the Family |
| F | Mature Homekeepers | F22 | Small Town Generations |
| F | Mature Homekeepers | F23 | Childfree Comfort |
| F | Mature Homekeepers | F24 | Modest Maturity |
| G | Suburban Childhoods | G25 | Mid-life Progress |
| G | Suburban Childhoods | G26 | Primary Commuters |
| G | Suburban Childhoods | G27 | Childcare Focus |
| H | New Beginnings | H28 | Modern Starters |
| H | New Beginnings | H29 | Early-years Pioneers |
| H | New Beginnings | H30 | Just Built |
| I | Family Endeavours | I31 | Small-scale Families |
| I | Family Endeavours | I32 | Squeezed Living |
| I | Family Endeavours | I33 | Bargain Homeowners |
| I | Family Endeavours | I34 | Cost-conscious Families |
| I | Family Endeavours | I35 | United Effort |
| J | Single Spaces | J36 | Suburban Simplicity |
| J | Single Spaces | J37 | Walk Up Workers |
| J | Single Spaces | J38 | Town Centre Tenants |
| K | Urban Basics | K39 | Downtown Thrift |
| K | Urban Basics | K40 | Pre-pension Squeeze |
| K | Urban Basics | K41 | No-frills Flats |
| L | Elderly Essentials | L42 | Retirement Living |
| L | Elderly Essentials | L43 | Senior Solitude |
| L | Elderly Essentials | L44 | Bedrock Bungalows |
| L | Elderly Essentials | L45 | Single Nostalgia |
| L | Elderly Essentials | L46 | Steadfast Couples |
| M | Modest Meadows | M47 | Rustic Retirement |
| M | Modest Meadows | M48 | Rural Roots |
| M | Modest Meadows | M49 | Workers Heritage |
| N | Value-seeking Families | N50 | Setting Up Home |
| N | Value-seeking Families | N51 | Budding Families |
| N | Value-seeking Families | N52 | Affordable Schoolyears |
| N | Value-seeking Families | N53 | Independent Parents |
| O | High-flying Metropolitans | O54 | City Sophisticates |
| O | High-flying Metropolitans | O55 | Urban Careers |
| O | High-flying Metropolitans | O56 | Bright Lights |
| O | High-flying Metropolitans | O57 | Contemporary Ambitions |
| P | Successful City Families | P58 | Urban Villa Lifestyles |
| P | Successful City Families | P59 | Close Kin |
| P | Successful City Families | P60 | Established Enterprises |
| P | Successful City Families | P61 | Tenured Terraces |
| Q | Side-by-side Economy | Q62 | Tight Spaces |
| Q | Side-by-side Economy | Q63 | Solo Resilience |
| Q | Side-by-side Economy | Q64 | Family Collectives |
| Q | Side-by-side Economy | Q65 | Shared Costs |
| R | Youthful Independence | R66 | A Space of their Own |
| R | Youthful Independence | R67 | Communal Cohorts |
| R | Youthful Independence | R68 | Student Pods |
True size of countries
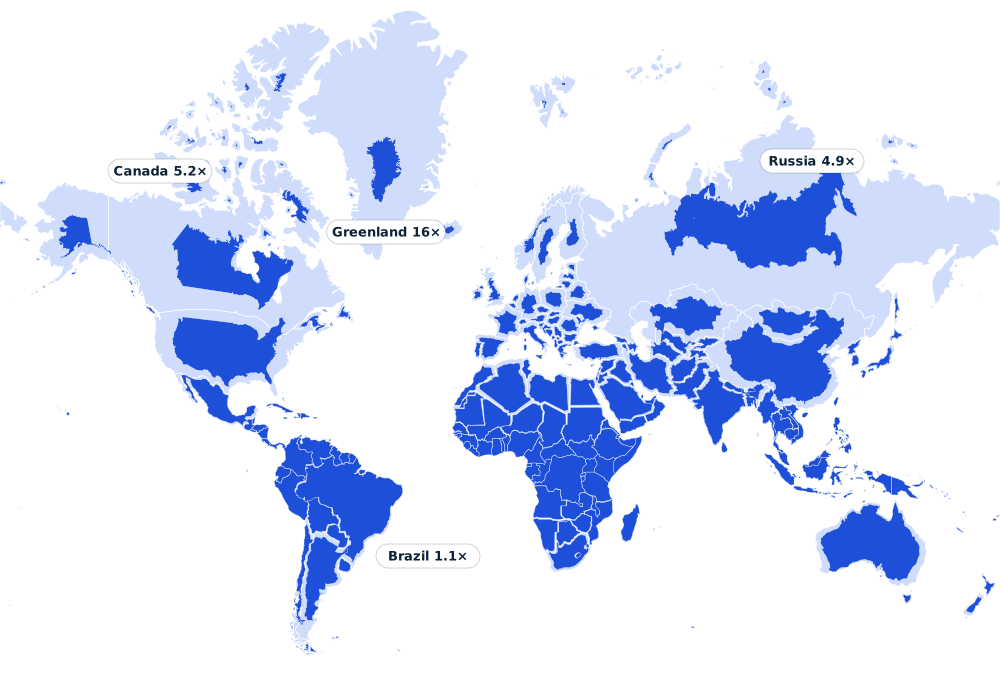
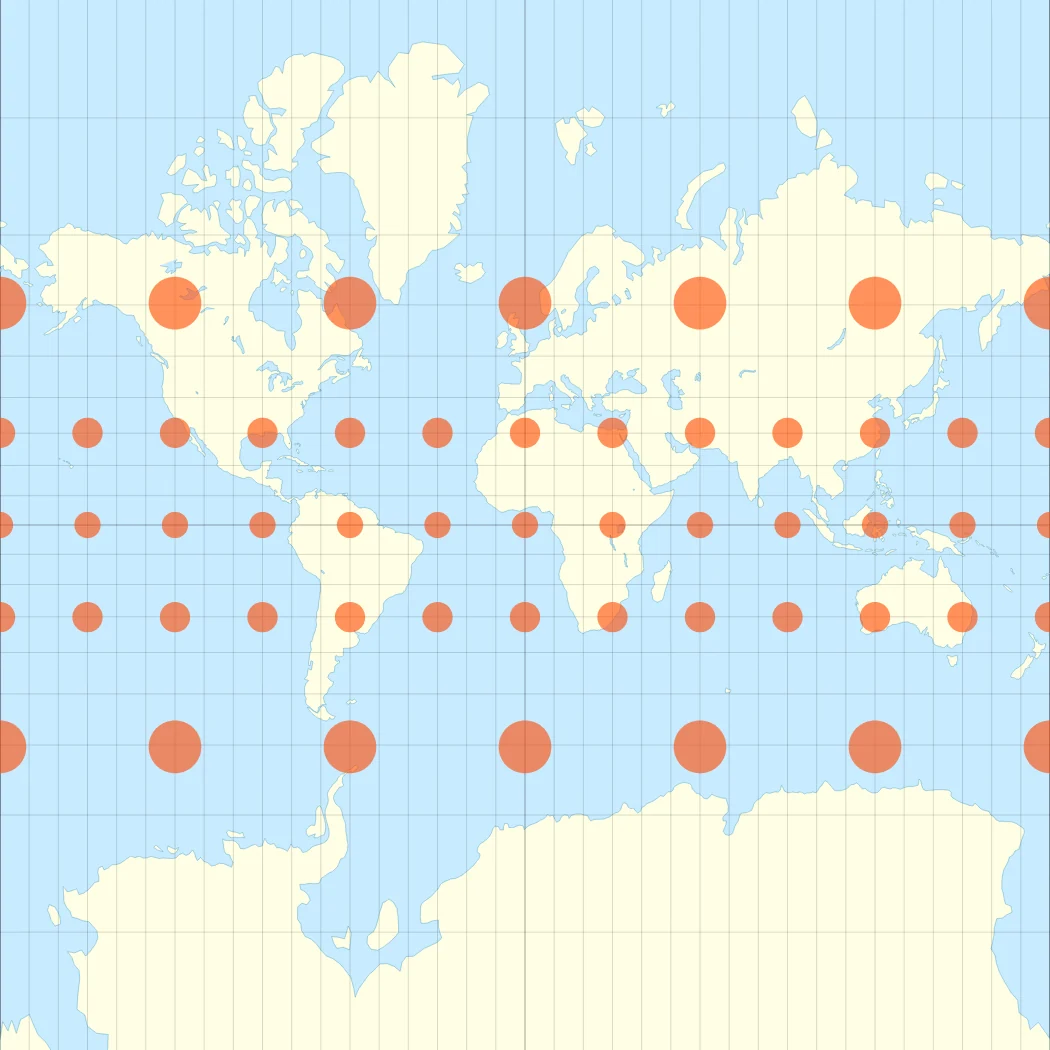
The Mercator projection is a cylindrical map projection. It became the standard map projection for navigation because it is unique in representing north as up and south as down everywhere while preserving local directions and shapes.
As a side effect, the Mercator projection inflates the size of objects away from the equator. Turning the curved surface of the Earth into a flat map always distorts something: the Mercator projection keeps shapes and directions, and gives up true sizes.


Geographic information
The table below lists the land area, population and population density of every country. Population figures are 2023 estimates.
| Country | Land area (km²) | Population | Density (people/km²) |
|---|---|---|---|
| Afghanistan | 652,860 | 42,239,854 | 65 |
| Albania | 27,400 | 2,832,439 | 103 |
| Algeria | 2,381,740 | 45,606,480 | 19 |
| Andorra | 470 | 80,088 | 170 |
| Angola | 1,246,700 | 36,684,202 | 29 |
| Antigua and Barbuda | 440 | 94,298 | 214 |
| Argentina | 2,736,690 | 45,773,884 | 17 |
| Armenia | 28,470 | 2,777,970 | 98 |
| Australia | 7,682,300 | 26,439,111 | 3 |
| Austria | 82,409 | 8,958,960 | 109 |
| Azerbaijan | 82,658 | 10,412,651 | 126 |
| Bahamas | 10,010 | 412,623 | 41 |
| Bahrain | 760 | 1,485,509 | 1,955 |
| Bangladesh | 130,170 | 172,954,319 | 1,329 |
| Barbados | 430 | 281,995 | 656 |
| Belarus | 202,910 | 9,498,238 | 47 |
| Belgium | 30,280 | 11,686,140 | 386 |
| Belize | 22,810 | 410,825 | 18 |
| Benin | 112,760 | 13,712,828 | 122 |
| Bhutan | 38,117 | 787,424 | 21 |
| Bolivia | 1,083,300 | 12,388,571 | 11 |
| Bosnia and Herzegovina | 51,000 | 3,210,847 | 63 |
| Botswana | 566,730 | 2,675,352 | 5 |
| Brazil | 8,358,140 | 216,422,446 | 26 |
| Brunei | 5,270 | 452,524 | 86 |
| Bulgaria | 108,560 | 6,687,717 | 62 |
| Burkina Faso | 273,600 | 23,251,485 | 85 |
| Burundi | 25,680 | 13,238,559 | 516 |
| Côte d’Ivoire | 318,000 | 28,873,034 | 91 |
| Cabo Verde | 4,030 | 598,682 | 149 |
| Cambodia | 176,520 | 16,944,826 | 96 |
| Cameroon | 472,710 | 28,647,293 | 61 |
| Canada | 9,093,510 | 38,781,291 | 4 |
| Central African Republic | 622,980 | 5,742,315 | 9 |
| Chad | 1,259,200 | 18,278,568 | 15 |
| Chile | 743,532 | 19,629,590 | 26 |
| China | 9,388,211 | 1,425,671,352 | 152 |
| Colombia | 1,109,500 | 52,085,168 | 47 |
| Comoros | 1,861 | 852,075 | 458 |
| Congo (Congo-Brazzaville) | 341,500 | 6,106,869 | 18 |
| Costa Rica | 51,060 | 5,212,173 | 102 |
| Croatia | 55,960 | 4,008,617 | 72 |
| Cuba | 106,440 | 11,194,449 | 105 |
| Cyprus | 9,240 | 1,260,138 | 136 |
| Czechia (Czech Republic) | 77,240 | 10,495,295 | 136 |
| Democratic Republic of the Congo | 2,267,050 | 102,262,808 | 45 |
| Denmark | 42,430 | 5,910,913 | 139 |
| Djibouti | 23,180 | 1,136,455 | 49 |
| Dominica | 750 | 73,040 | 97 |
| Dominican Republic | 48,320 | 11,332,972 | 235 |
| Ecuador | 248,360 | 18,190,484 | 73 |
| Egypt | 995,450 | 112,716,598 | 113 |
| El Salvador | 20,720 | 6,364,943 | 307 |
| Equatorial Guinea | 28,050 | 1,714,671 | 61 |
| Eritrea | 101,000 | 3,748,901 | 37 |
| Estonia | 42,390 | 1,322,765 | 31 |
| Eswatini (fmr. “Swaziland”) | 17,200 | 1,210,822 | 70 |
| Ethiopia | 1,000,000 | 126,527,060 | 127 |
| Fiji | 18,270 | 936,375 | 51 |
| Finland | 303,890 | 5,545,475 | 18 |
| France | 547,557 | 64,756,584 | 118 |
| Gabon | 257,670 | 2,436,566 | 9 |
| Gambia | 10,120 | 2,773,168 | 274 |
| Georgia | 69,490 | 3,728,282 | 54 |
| Germany | 348,560 | 83,294,633 | 239 |
| Ghana | 227,540 | 34,121,985 | 150 |
| Greece | 128,900 | 10,341,277 | 80 |
| Grenada | 340 | 126,183 | 371 |
| Guatemala | 107,160 | 18,092,026 | 169 |
| Guinea | 245,720 | 14,190,612 | 58 |
| Guinea-Bissau | 28,120 | 2,150,842 | 76 |
| Guyana | 196,850 | 813,834 | 4 |
| Haiti | 27,560 | 11,724,763 | 425 |
| Holy See | – | 518 | 1,295 |
| Honduras | 111,890 | 10,593,798 | 95 |
| Hungary | 90,530 | 10,156,239 | 112 |
| Iceland | 100,250 | 375,318 | 4 |
| India | 2,973,190 | 1,428,627,663 | 481 |
| Indonesia | 1,811,570 | 277,534,122 | 153 |
| Iran | 1,628,550 | 89,172,767 | 55 |
| Iraq | 434,320 | 45,504,560 | 105 |
| Ireland | 68,890 | 5,056,935 | 73 |
| Israel | 21,640 | 9,174,520 | 424 |
| Italy | 294,140 | 58,870,762 | 200 |
| Jamaica | 10,830 | 2,825,544 | 261 |
| Japan | 364,555 | 123,294,513 | 338 |
| Jordan | 88,780 | 11,337,052 | 128 |
| Kazakhstan | 2,699,700 | 19,606,633 | 7 |
| Kenya | 569,140 | 55,100,586 | 97 |
| Kiribati | 810 | 133,515 | 165 |
| Kuwait | 17,820 | 4,310,108 | 242 |
| Kyrgyzstan | 191,800 | 6,735,347 | 35 |
| Laos | 230,800 | 7,633,779 | 33 |
| Latvia | 62,200 | 1,830,211 | 29 |
| Lebanon | 10,230 | 5,353,930 | 523 |
| Lesotho | 30,360 | 2,330,318 | 77 |
| Liberia | 96,320 | 5,418,377 | 56 |
| Libya | 1,759,540 | 6,888,388 | 4 |
| Liechtenstein | 160 | 39,584 | 247 |
| Lithuania | 62,674 | 2,718,352 | 43 |
| Luxembourg | 2,590 | 654,768 | 253 |
| Madagascar | 581,795 | 30,325,732 | 52 |
| Malawi | 94,280 | 20,931,751 | 222 |
| Malaysia | 328,550 | 34,308,525 | 104 |
| Maldives | 300 | 521,021 | 1,737 |
| Mali | 1,220,190 | 23,293,698 | 19 |
| Malta | 320 | 535,064 | 1,672 |
| Marshall Islands | 180 | 41,996 | 233 |
| Mauritania | 1,030,700 | 4,862,989 | 5 |
| Mauritius | 2,030 | 1,300,557 | 641 |
| Mexico | 1,943,950 | 128,455,567 | 66 |
| Micronesia | 700 | 115,224 | 165 |
| Moldova | 32,850 | 3,435,931 | 105 |
| Monaco | 1 | 36,297 | 24,360 |
| Mongolia | 1,553,560 | 3,447,157 | 2 |
| Montenegro | 13,450 | 626,485 | 47 |
| Morocco | 446,300 | 37,840,044 | 85 |
| Mozambique | 786,380 | 33,897,354 | 43 |
| Myanmar (formerly Burma) | 653,290 | 54,577,997 | 84 |
| Namibia | 823,290 | 2,604,172 | 3 |
| Nauru | 20 | 12,780 | 639 |
| Nepal | 143,350 | 30,896,590 | 216 |
| Netherlands | 33,720 | 17,618,299 | 522 |
| New Zealand | 263,310 | 5,228,100 | 20 |
| Nicaragua | 120,340 | 7,046,310 | 59 |
| Niger | 1,266,700 | 27,202,843 | 21 |
| Nigeria | 910,770 | 223,804,632 | 246 |
| North Korea | 120,410 | 26,160,821 | 217 |
| North Macedonia | 25,220 | 2,085,679 | 83 |
| Norway | 365,268 | 5,474,360 | 15 |
| Oman | 309,500 | 4,644,384 | 15 |
| Pakistan | 770,880 | 240,485,658 | 312 |
| Palau | 460 | 18,058 | 39 |
| Palestine State | 6,020 | 5,371,230 | 892 |
| Panama | 74,340 | 4,468,087 | 60 |
| Papua New Guinea | 452,860 | 10,329,931 | 23 |
| Paraguay | 397,300 | 6,861,524 | 17 |
| Peru | 1,280,000 | 34,352,719 | 27 |
| Philippines | 298,170 | 117,337,368 | 394 |
| Poland | 306,230 | 41,026,067 | 134 |
| Portugal | 91,590 | 10,247,605 | 112 |
| Qatar | 11,610 | 2,716,391 | 234 |
| Romania | 230,170 | 19,892,812 | 86 |
| Russia | 16,376,870 | 144,444,359 | 9 |
| Rwanda | 24,670 | 14,094,683 | 571 |
| Saint Kitts and Nevis | 260 | 47,755 | 184 |
| Saint Lucia | 610 | 180,251 | 295 |
| Saint Vincent and the Grenadines | 390 | 103,698 | 266 |
| Samoa | 2,830 | 225,681 | 80 |
| San Marino | 60 | 33,642 | 561 |
| Sao Tome and Principe | 960 | 231,856 | 242 |
| Saudi Arabia | 2,149,690 | 36,947,025 | 17 |
| Senegal | 192,530 | 17,763,163 | 92 |
| Serbia | 87,460 | 7,149,077 | 82 |
| Seychelles | 460 | 107,660 | 234 |
| Sierra Leone | 72,180 | 8,791,092 | 122 |
| Singapore | 700 | 6,014,723 | 8,592 |
| Slovakia | 48,088 | 5,795,199 | 121 |
| Slovenia | 20,140 | 2,119,675 | 105 |
| Solomon Islands | 27,990 | 740,424 | 26 |
| Somalia | 627,340 | 18,143,378 | 29 |
| South Africa | 1,213,090 | 60,414,495 | 50 |
| South Korea | 97,230 | 51,784,059 | 533 |
| South Sudan | 610,952 | 11,088,796 | 18 |
| Spain | 498,800 | 47,519,628 | 95 |
| Sri Lanka | 62,710 | 21,893,579 | 349 |
| Sudan | 1,765,048 | 48,109,006 | 27 |
| Suriname | 156,000 | 623,236 | 4 |
| Sweden | 410,340 | 10,612,086 | 26 |
| Switzerland | 39,516 | 8,796,669 | 223 |
| Syria | 183,630 | 23,227,014 | 126 |
| Tajikistan | 139,960 | 10,143,543 | 72 |
| Tanzania | 885,800 | 67,438,106 | 76 |
| Thailand | 510,890 | 71,801,279 | 141 |
| Timor-Leste | 14,870 | 1,360,596 | 91 |
| Togo | 54,390 | 9,053,799 | 166 |
| Tonga | 720 | 107,773 | 150 |
| Trinidad and Tobago | 5,130 | 1,534,937 | 299 |
| Tunisia | 155,360 | 12,458,223 | 80 |
| Turkey | 769,630 | 85,816,199 | 112 |
| Turkmenistan | 469,930 | 6,516,100 | 14 |
| Tuvalu | 30 | 11,396 | 380 |
| Uganda | 199,810 | 48,582,334 | 243 |
| Ukraine | 579,320 | 36,744,634 | 63 |
| United Arab Emirates | 83,600 | 9,516,871 | 114 |
| United Kingdom | 241,930 | 67,736,802 | 280 |
| United States of America | 9,147,420 | 339,996,563 | 37 |
| Uruguay | 175,020 | 3,423,108 | 20 |
| Uzbekistan | 425,400 | 35,163,944 | 83 |
| Vanuatu | 12,190 | 334,506 | 27 |
| Venezuela | 882,050 | 28,838,499 | 33 |
| Vietnam | 310,070 | 98,858,950 | 319 |
| Yemen | 527,970 | 34,449,825 | 65 |
| Zambia | 743,390 | 20,569,737 | 28 |
| Zimbabwe | 386,850 | 16,665,409 | 43 |